
According to the preliminary corporate management analysis for 2025 released by the Bank of Korea (BOK), the revenue growth rate for non-financial corporations subject to external audits stood at 2.5 percent last year. That was down 1.7 percentage points from 4.2 percent a year earlier.
The headline profitability improved sharply. The operating profit margin rose from 5.4 percent in 2024 to 6.2 percent last year, marking the highest level since 2021, when it stood at 6.8 percent.
The pre-tax net profit margin also climbed from 5.2 percent to 6.3 percent.
The overall corporate balance sheet also strengthened. The debt-to-equity ratio fell from 103.4 percent to 98.3 percent, and borrowing dependency dropped from 28.4 percent to 27.3 percent.
It marked the first time in five years that the average debt ratio fell below 100 percent, since 2020, when it recorded 97.3 percent.
Top-line growth slowed across both manufacturing and non-manufacturing sectors. Revenue growth in manufacturing fell from 5.2 percent to 3.2 percent, while non-manufacturing growth dropped from 3.0 percent to 1.6 percent.
Within manufacturing, petroleum refining and chemicals suffered notable slumps. Revenue growth for petroleum refining and coke swung from 1.0 percent to negative 7.4 percent, while chemicals fell from 4.0 percent to negative 2.4 percent.
The BOK attributed the decline in refining to deteriorating supply-demand conditions and lower oil prices. Chemicals were hit by persistent global oversupply.
In the non-manufacturing sector, the construction slump was stark. The construction revenue growth rate deepened its decline from negative 3.2 percent to negative 9.6 percent.
The BOK said construction was dragged down by shrinking real estate demand and a prolonged slowdown in housing starts since 2023.
By company size, growth weakened across the board. Large companies saw revenue growth slow from 4.4 percent to 2.8 percent, while small- and medium-sized enterprises (SMEs) cooled from 3.2 percent to 1.2 percent.
The rebound in profitability was led largely by the semiconductor sector. The manufacturing operating profit margin rose from 5.5 percent to 6.9 percent, while the margin for electronic, visual and communications equipment jumped from 8.8 percent to 15.0 percent.
The BOK said rising semiconductor prices and increased sales of high-value-added products for AI servers drove the improvement. However, the sector's revenue growth slowed from 21.6 percent to 15.1 percent, indicating a moderation in growth momentum.
Utilities also helped lift non-manufacturing profitability. The operating profit margin for electricity and gas rose from 5.8 percent to 8.3 percent, helped by utility rate adjustments, lower power purchase costs and fiscal normalization efforts.
The aggregate improvement did not translate into broader corporate health. Large companies' operating profit margin rose from 5.6 percent to 6.6 percent, while SME margins slipped from 4.8 percent to 4.6 percent.
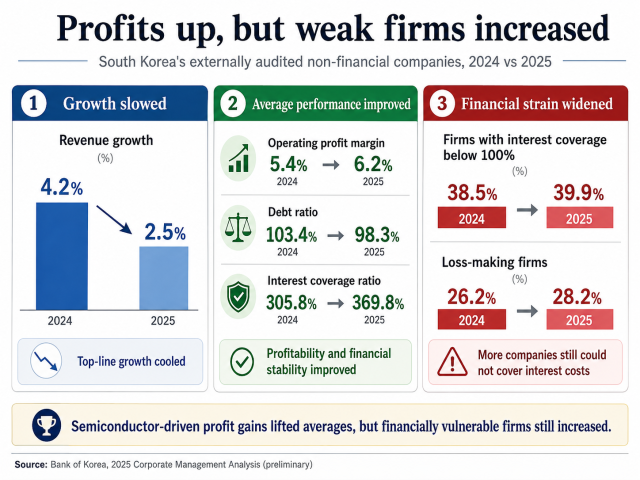
A similar divergence was evident in debt-servicing capacity. The overall interest coverage ratio rose from 305.8 percent to 369.8 percent, supported by higher operating margins and lower financing burdens.
However, the share of firms with an interest coverage ratio below 100 percent expanded from 38.5 percent to 39.9 percent.
An interest coverage ratio below 100 percent means a company's operating profits are insufficient to cover its interest expenses. The BOK said the share was the highest since the current data series began in 2013.
The strain was also visible in the distribution of corporate earnings. The proportion of loss-making companies grew from 26.2 percent to 28.2 percent.
The share of firms with an interest coverage ratio of 500 percent or higher shrank from 33.1 percent to 32.6 percent. This indicates that strong performances by a handful of large tech firms lifted aggregate averages, even as financial strains on vulnerable businesses worsened amid sluggish domestic demand and elevated interest rates.
Cash flows improved marginally as operating activities generated stronger inflows. The cash flow coverage ratio rose from 51.4 percent to 52.8 percent.
The preliminary statistics are based on a survey of 34,456 non-financial corporations subject to external audits that filed audit reports as of the end of 2025, excluding certain companies and industries.

Copyright ⓒ Aju Press All rights reserved.